chart.js是一個很容易操作的圖表工具,只要設定好參數,就可以在頁面呈現漂漂亮亮的圖表
先載入Chart.js
CDN : https://cdnjs.com/libraries/Chart.js
<script src="https://cdnjs.cloudflare.com/ajax/libs/Chart.js/2.8.0/Chart.bundle.js" integrity="undefined" crossorigin="anonymous"></script>
在要顯示圖表的位置加入 <canvas> 標籤
<canvas id="myChart1" ></canvas>
設定圖表
<script>
var ctx = document.getElementById('myChart1').getContext('2d');
var chart = new Chart(ctx, {
type: 'bar', // 圖表類別 bar:柱狀 line:曲線 pie:圓餅
data: {
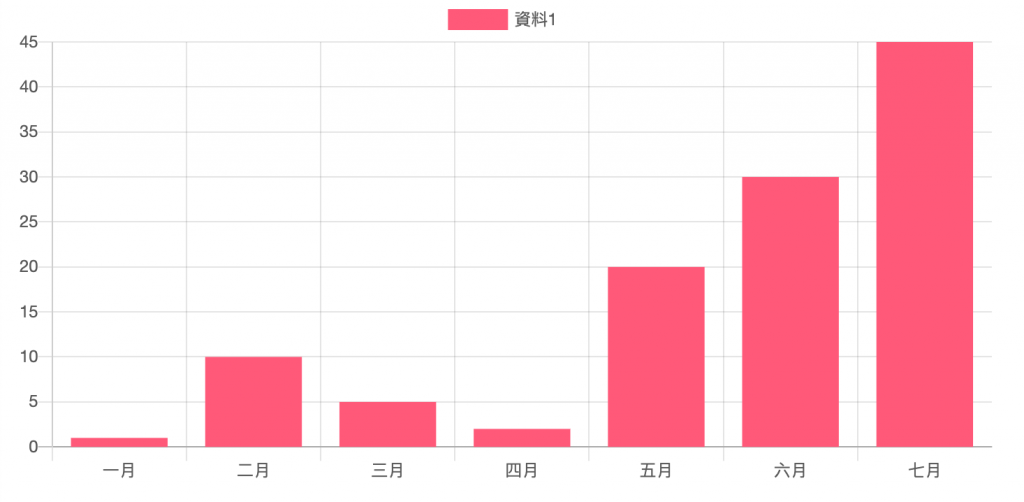
labels: ['一月', '二月', '三月', '四月', '五月', '六月', '七月'], //X軸
datasets: [{
label: '資料1', // 資料名稱
backgroundColor: 'rgb(255, 99, 132)', // 顏色
borderColor: 'rgb(255, 99, 132)', // 邊框顏色
data: [1, 10, 5, 2, 20, 30, 45] // 資料
}]
},
options: {}
});
</script>
設定好就會出現圖表
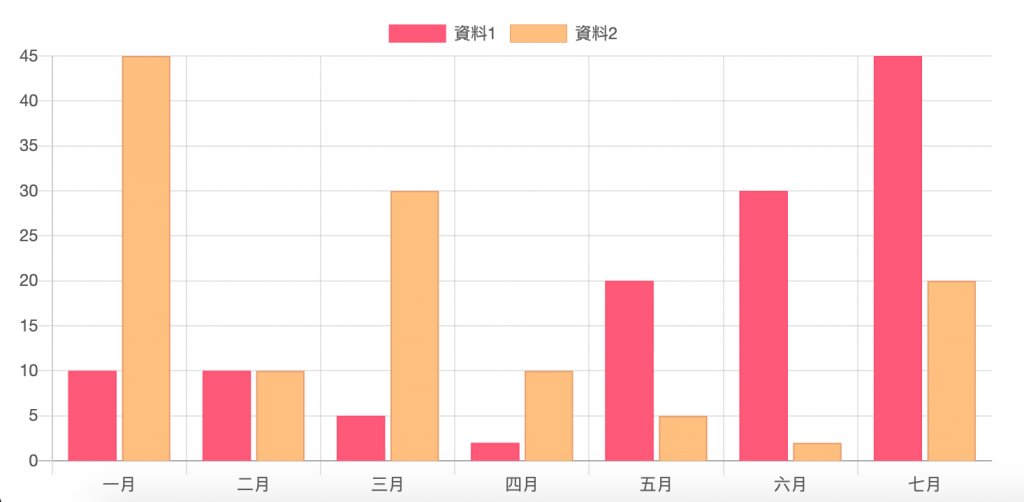
如果要多筆資料:
var ctx2 = document.getElementById('myChart2').getContext('2d');
var chart = new Chart(ctx2, {
    type: 'bar',

    data: {
        labels: ['一月', '二月', '三月', '四月', '五月', '六月', '七月'],
        datasets: [{
            label: '資料1',
            borderWidth : 1,
            backgroundColor: 'rgb(255, 99, 132)',
            borderColor: 'rgb(245, 89, 122)',
            data: [10, 10, 5, 2, 20, 30, 45]
        },{
            label: '資料2',
            borderWidth : 1,
            backgroundColor: 'rgb(255, 199, 132)',
            borderColor: 'rgb(225, 169, 122)',
            data: [ 45,10,30,10, 5, 2, 20]
        }]
    },

    // Configuration options go here
    options: {}
});
調整大小
<div class="chart-container" style="position: relative; height:50%; width:50%" >
<canvas id="myChart1" ></canvas>
</div>
chart.js官網:https://www.chartjs.org/docs/latest/
各種圖表範本:https://www.chartjs.org/samples/latest/

